.svg "Clarion Horizontal logo-01 (1)")
Discover whether Power BI or Tableau is the best choice for your data analytics needs in this detailed comparison. Clarion Technologies breaks down the strengths and weaknesses of each platform to help you make an informed decision. Learn which tool offers the best features, integrations, and cost-effectiveness for your business.
Key Takeaways
- Power BI initially offers a lower price compared to Tableau. However, the cost can increase as you scale up features and add more users.
- While Tableau is explicitly designed for data analysts, Power BI caters to a broader audience, providing business intelligence tools that enhance overall analytics for various users.
Data visualization and analytics landscape is rapidly evolving, with new competitors entering the market and established companies frequently acquiring smaller, innovative firms. To remain a leader in the data analytics industry, a tool must combine power, user-friendliness, brand reputation, and affordability. Microsoft Power BI and Tableau possess these qualities, making them popular choices for teams seeking the ideal data analytics tool. However, Power BI and Tableau are not the only prominent players in the business intelligence arena.
Importance of Data Visualization Tools in Business Analytics
Data visualization tools are crucial for business analytics as they allow users to explore and interpret data quickly and efficiently. Presenting data in various visual formats helps users effectively communicate their findings to stakeholders and other decision-makers. These tools enable users to discover correlations, patterns, and trends within their data, which can lead to more informed business decisions. They also help identify new opportunities and anticipate potential issues before they arise.
Data visualization tools allow organizations to grasp intricate information quickly and easily by offering a visual representation of complex datasets. This capability can accelerate decision-making processes and improve the accuracy of future performance predictions.
Moreover, the right data visualization tool allows users to create visually appealing dashboards and reports that are accessible to non-technical individuals within an organization. This ease of comprehension facilitates the sharing of information across different departments or with stakeholders who may not be familiar with the technical details of the platform.
This blog will help you understand the differences between Power BI and Tableau.
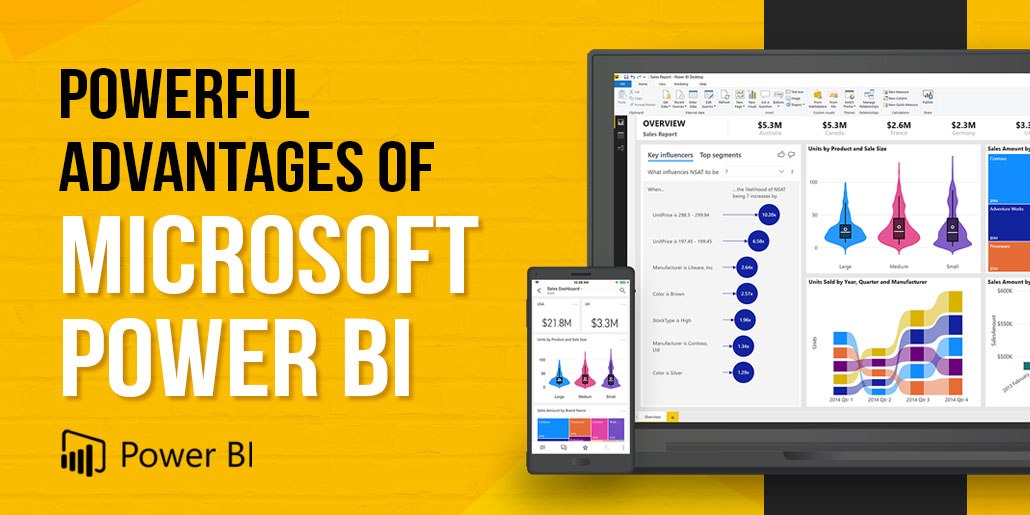
About Power BI
Microsoft Power BI integrates software services, applications, and connectors to turn various data sources into cohesive, visually engaging, and interactive insights.
Seamlessly connecting with Excel spreadsheets, cloud-based systems, and on-premises data warehouses, Power BI allows users to link to their data sources, visualize and uncover key insights, and share these insights across their organization or with external stakeholders.
The platform includes multiple components: Power BI Desktop for report creation, the Power BI service for online sharing and viewing of reports and dashboards, and Power BI Mobile apps for accessing business insights on the go. This setup supports a flexible and efficient workflow, from data connection and report creation in Power BI Desktop to publishing and sharing via the Power BI service.
Key Features
- Integration with Microsoft ecosystems works seamlessly with azure and office 365
- Affordable pricing offers a robust free version with scalable premium options
- User-friendly interface features intuitive drag-and-drop functionalities
- Real-time data access provides up-to-date insights
- Comprehensive API access includes pre-built dashboards for various data sources
- Advanced natural language query capabilities allows easy data interrogation through natural language
Pros and Cons of Power BI: The most user-friendly tool
|
Pros |
Cons |
|
Cost-effective: particularly advantageous for small to medium-sized businesses and startups |
Limited advanced analytics: lacks some of the more sophisticated analytics features found in Tableau |
|
Microsoft integration: seamlessly works with Microsoft products like Azure, SQL Server, and Excel |
|
|
User-friendly: designed to be accessible for a general audience |
Free version constraints: the free version has limited visualization capabilities |
|
Real-time data access: offers intuitive drag-and-drop functionalities for real-time insights |
|
|
Comprehensive API access: provides pre-built dashboards for popular services |
Scaling costs: expenses can increase with additional features and users
|
|
Native apps and alerts: includes native applications and alert features
|
About Tableau
Tableau is a powerful visual analytics tool designed to simplify data analysis and facilitate the sharing of insights with an intuitive drag-and-drop interface. It enables users to analyze data from various sources, such as Excel and cloud services, without requiring advanced programming skills. Users can also create interactive dashboards to highlight data trends and patterns. Originating from a Stanford project, Tableau has evolved into a leading business intelligence platform and was acquired by Salesforce in 2019.
Pros and Cons of Tableau: The ideal tool for data visualization
|
Pros |
Cons |
|
Salesforce integration: integrates seamlessly with the Salesforce ecosystem |
Steep learning curve: requires more time and effort to master |
|
Diverse data source options: connects with a wide range of data sources, including Alibaba Data Lake and Google Ads |
|
|
Detailed visualization control: offers granular control over visualizations |
Higher cost: generally more expensive than Power BI |
|
Community and support: boasts a large user community and excellent customer support |
|
|
Performance with large data sets: excels in handling large datasets |
No versioning or change management: Lacks built-in version control and change management features
|
|
Support for R and Python: allows integration with R and Python for advanced analytics |
Power BI vs Tableau: Complete in-depth Comparison
- Data Visualization
When comparing the visualization capabilities of Tableau and Power BI, both excel in their own ways. Tableau is renowned for its advanced data modeling, offering a wide array of visualizations including classic line and bar charts, scatter plots, geographic maps, bubble charts, and tree maps. This makes it ideal for visualizing complex data sets with high precision, as Tableau provides pixel-perfect control for analysts.
Power BI also features a diverse range of charts and graphs, but its selection is somewhat more limited than Tableau's. This is partly because Power BI's design is influenced by other Microsoft products, particularly Office, which means its visualizations tend to be simpler. This simplicity can be advantageous for analysts who favor classic, straightforward visual representations.
- Integrations and connections
Deciding whether Power BI or Tableau is better for integrations and connections depends on your specific needs. Both tools offer numerous native data connectors, including those for Microsoft SQL Server, PostgreSQL, and Google Analytics. However, each platform has unique connectors that the other might not support, making one more convenient than the other depending on your data sources.
Power BI, being a Microsoft product, integrates seamlessly with other Microsoft systems. Tableau, now part of Salesforce, offers a more integrated experience for Salesforce users. Nonetheless, both platforms can connect to a wide range of data sources outside their primary ecosystems.
- UI/UX
Both Power BI and Tableau have user-friendly interfaces designed to provide a good user experience. They both feature drag-and-drop functionalities, making them accessible for non-technical users. Power BI has an edge in that many features are available directly on the dashboard, reducing the need to navigate through multiple menus, which can make it easier to use, especially for beginners.
Power BI's interface is also similar to other Microsoft products, like Excel, which can shorten the learning curve for users familiar with Microsoft's ecosystem. Tableau, while intuitive, might require users to navigate more options to access certain features.
- Performance
Tableau generally performs better with very large data sets compared to Power BI. Both tools offer in-memory caching to speed up data processing, but Power BI can be slower with bulk data. That said, with smaller data sets, the performance difference between the two can be negligible. In some cases, Power BI may even outperform Tableau when dealing with limited data volumes. Therefore, if your organization deals with extremely large data sets, Tableau might be the better choice. For smaller data sets, Power BI could be more efficient.
- Products
Both Power BI and Tableau offer a suite of products, each catering to different needs:
Power BI Products:
- Power BI Desktop: a free tool for reporting and visualization with limited features
- Power BI Service: a cloud-based platform for dashboard and report publishing, available in different license levels
- Power BI Pro: a comprehensive cloud-based solution
- Power BI Premium: an advanced service with AI capabilities
- Power BI Mobile: a mobile app for accessing dashboards
- Power BI Report Server: an on-premises solution for enterprise reporting
Tableau Products:
- Tableau Public: a free version for creating visualizations with limited features
- Tableau Server: an enterprise platform for data management
- Tableau Cloud: a fully hosted cloud solution
- Tableau Desktop: a self-service tool for data visualization and analysis
- Tableau Mobile: an app for accessing Tableau Cloud or Server on mobile devices
- Tableau Reader: a free desktop application for viewing data visualizations
- Cost
Power BI tends to be more cost-effective than Tableau. Pricing for Power BI is typically based on per-user or per-capacity models, offering flexibility depending on the organization’s needs. Here’s a breakdown of Power BI pricing:
- Power BI Pro: $10 per user/month
- Power BI Premium: $20 per user/month
- Per-capacity pricing ranges from $262.80 to $4,995 per month, depending on the service level.
Tableau’s pricing varies by user type:
- Tableau Viewer: $15 per user/month
- Tableau Explorer: $42 per user/month
- Tableau Creator: $75 per user/month
Additional costs can include Tableau Cloud or Tableau Server subscriptions and any necessary training or infrastructure.
- Security
Both Tableau and Power BI provide robust security measures. Their cloud services ensure secure connections, and both support row-level security. Power BI leverages Azure Active Directory for user authentication and enforces transport layer security (TLS). Tableau also offers comprehensive authentication and security configuration options for administrators.
- Dashboards
Both platforms offer user-friendly dashboards that are easy to navigate. Tableau’s dashboard creation is code-free and supports real-time commenting for enhanced collaboration. Power BI also features an intuitive navigation pane and supports real-time data updates, eliminating the need for manual refreshes.
- Reporting
Power BI supports both automatic refresh schedules and manual refreshes, ensuring that reports always display the latest data. It also allows for ad-hoc reporting and intuitive report sharing to facilitate collaboration.
Tableau is also highly capable in report creation but lacks automatic refreshing, requiring manual updates to ensure data is current. Despite this, the process of updating and sharing reports in Tableau is straightforward.
- Data Sources
When selecting a business intelligence solution, compatibility with your preferred data sources is crucial. Both Tableau and Power BI support a wide range of data sources, but there are differences between the two. While Tableau and Power BI are similar, they are not identical in terms of data source support.
|
Power BI data sources |
Tableau data sources |
|
Adobe Analytics
|
Alibaba Data Lake and Analytics |
|
Amazon Redshift |
Amazon Redshift
|
|
Azure SQL |
Azure SQL
|
|
BigQuery |
Google Ads
|
|
Excel |
Google Analytics
|
|
|
IBM DB2
|
|
Google Analytics |
Excel
|
|
Hadoop |
PostgreSQL
|
|
Python Script |
Python Script
|
|
R Script |
Salesforce Report
|
- Support
Both Tableau and Power BI offer customer service options, but Tableau is generally recognized for having superior customer support. Tableau's responsiveness is a significant advantage for organizations that may encounter issues and need prompt assistance.
Additionally, Tableau boasts a large, active user community that frequently shares tips, provides insights, and showcases resources. This community engagement offers an extra layer of support, enabling users to find quick answers and discover best practices to improve efficiency.
In contrast, the Power BI community is smaller. While it still offers valuable resources and support, it doesn't match the breadth and activity level of the Tableau community.
How is Power BI Different from Tableau?
Power BI leverages existing Microsoft systems like Azure, SQL, and Excel to create cost-effective data visualizations. This makes it an excellent choice for users already integrated into the Microsoft ecosystem, including Azure, Office 365, and Excel. Additionally, Power BI is a budget-friendly option for small to medium-sized businesses and startups that need robust data visualization without a substantial financial investment.

Figure 1 - A dashboard in Power BI from Microsoft
Tableau on the other hand, excels in producing visually stunning visualizations and is often marketed towards corporate environments with data engineers and larger budgets. While Tableau offers a free public version, its capabilities are limited. Higher-priced versions unlock more features, including access to third-party benchmarked data. Tableau also provides specific tools for non-profit organizations and academic institutions.

Figure 2 - Tableau sales and marketing dashboard
How is Power BI Similar to Tableau?
Power BI and Tableau aim to convert data into actionable insights through sophisticated visualizations. They provide various analytics, dashboard, and reporting features to meet various user requirements.
These platforms are designed to make data analysis accessible and facilitate decision-making processes at different organizational levels. Both emphasize user-friendly interfaces, though they approach usability and complexity differently.
Is Power BI better than Tableau, or is Tableau better than Power BI?
Power BI stands out as the more budget-friendly option, particularly attractive for those already immersed in the Microsoft ecosystem. Its seamless integration with other Microsoft products like Excel and SharePoint enhances its appeal due to the connectivity and familiarity it offers users within that environment. The availability of a free version, along with the relatively low cost of the Pro version, makes Power BI accessible to a wide range of users, from small businesses to large enterprises. This makes it an excellent choice for companies looking to hire Power BI developers who can leverage these integrations effectively.
On the other hand, Tableau, though more expensive, excels in providing superior data visualization capabilities and efficiently handling large volumes of data. It offers a broader range of data source integrations and boasts an active community that serves as a valuable resource for users. Tableau’s pricing structure is designed to accommodate different types of users within an organization, from those who only need to view dashboards to those requiring full creation and analysis capabilities. This makes it a compelling option for businesses looking to hire Tableau developers to maximize their data analytics potential.
Making Your Choice
Deciding between Power BI and Tableau ultimately depends on specific business needs, budget constraints, and the scale of data handling required. Power BI is a cost-effective, user-friendly option for those heavily integrated with Microsoft’s suite of products, making it an ideal choice for many small to medium-sized businesses. For companies needing to hire Power BI developers, this integration can be a significant advantage.
Conversely, Tableau is a powerful tool for organizations that prioritize advanced data visualization and analytics capabilities and are willing to invest more in their business intelligence tools. Its flexibility and robust community support make it a strong candidate for enterprises looking to hire Tableau developers who can exploit its advanced features.
Both platforms have their strengths and can meet a wide range of business intelligence needs, from simple reporting to complex data analysis. When making a choice, consider the total cost of ownership, including licensing and the potential need for premium support, to determine the best fit for your organization’s specific requirements.