Technology has drastically changed every field to provide greater efficiency. It has also greatly benefited the pharmaceutical and healthcare industries as it has helped maintain the pharmaceutical industry's resilience. These industries have widely used digital solutions to increase productivity and streamline processes.
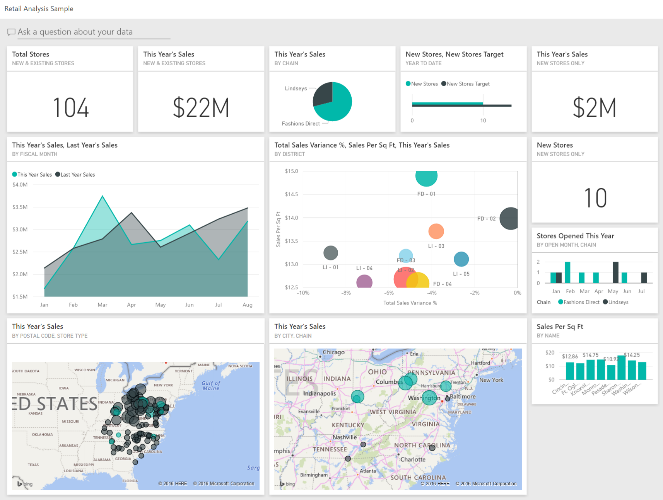
With the help of Power BI developers, you can set up quick inquiries and analysis reports. It has facilitated using simple tools and a robust natural language interface. In addition, the Power BI tools are easy to use and quick to deploy.
In healthcare and pharma, you know that the process of establishing a data-driven approach is difficult for organizations. Only a powerful business intelligence system can recognize the given situation and, using its inbuilt intelligence, bring about a drastic shift. This is where the Power BI dashboard helps you to develop highly customizable, customer-focused charts, reports, and graphs.
According to McKinsey, the potential impact of predictive modeling on the discovery and optimization of new blockbuster medications in healthcare is high, increasing to 45 to 70 percent over a decade. As a result, the role of Power BI in healthcare is expanding with its potential use.
Pharmaceutical companies usually opt for in-depth competitor analysis and monitoring as well as optimize internal operations using data-backed insights with data analytics. Big data analytics for the pharma business promise various cutting-edge breakthroughs to deliver insights into pharma and help develop a fact-based strategy in the global market. These infrastructures also include advances in cloud computing, machine learning, etc.
Here are few topics that we have covered to highlight the importance of Power BI:
1. What is the Use of Power BI in Pharma and Healthcare?
- Reports

Source – microsoft.com
Its capabilities and unique visualizations make it possible to create and amend Power BI financial statements, including P&L statements, balance sheets, cash flows, and more. With these, you may quickly discover various tools that make real-time planning simple and allow you to immediately examine the impact of actual vs. predicted values on any financial statement. For users' convenience, it even offers Power BI income statement templates.
- KPI

Source – microsoft.com
The market for data analytics and BI (Business Intelligence) solutions that assist firms in making efficient data-driven choices is rapidly expanding. One such BI (Business Intelligence) solution is Power BI, which enables businesses to make the most of their consumer data and create eye-catching reports and dashboards. In addition, you may maintain track of your company's performance using engaging and educational Power BI-based KPIs method to help their teams set specific, well-defined targets.
- Analytics

Source – microsoft.com
For insights, forecasts, or recommendations, advanced analytics uses sophisticated tools and methodologies. As a result, they are often beyond those of traditional business intelligence (BI).
Microsoft Power BI provides advanced analytics to assist users in gaining crucial insights, turning data into discoveries, and solving business challenges. Business users can monitor essential performance metrics in real-time using Power BI's advanced analytics. In addition, it assists the company in identifying the indicators that lead to more success and opportunity.
Power BI offers beautiful and interactive dashboards with sophisticated data management solutions. It includes several capabilities that assist sophisticated analytics and employs data mining & BI systems to find data patterns.
- Sales and Marketing

Source – microsoft.com
Pharmaceutical firms may effectively measure sales performance and consumer behavior with BI software, which allows them to manage and enhance their marketing and sales strategy. In addition, to quickly evaluate current trends, market share, revenues, and sales performance, BI systems also proceed with external data about the market, competitors, and advertising efforts. Additionally, this Pharma-Data-powered software can effectively assess how well fresh items are selling so that businesses may take the necessary actions to increase their market share. As a result, pharmaceutical companies using BI tools improve their marketing and sales effectiveness by better understanding the overall sector.
- Logistics And Supply Chain

Source – microsoft.com
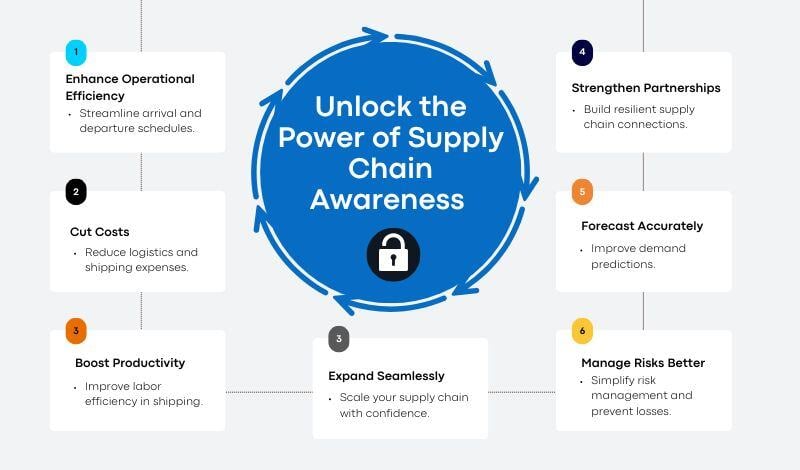
The supply chain produces the most extensive and rich drug data in your organization's areas, excluding sales operations. However, many businesses are wasting this valuable information. The fact is that pharma data analytics and Power BI visualizations can aid pharmaceutical and healthcare organizations in raising the efficiency and productivity of their supply chain and logistical procedures. This is an advantage of Power BI in healthcare sector.

Big data can reveal novel insights about consumer purchasing trends, maintenance cycles, and marketing trends. Additionally, look into ways to cut costs and enable more focused business decisions. Power BI for Pharma sector can help display data sets at each corporate level by integrating numerous data sources produced by the logistic and supply chain department through business intelligence solutions. Whatever the case, supply chain managers should embrace this digital change by incorporating big data and analytics in their organization.
2. What are the Best Power BI tools for Companies?
- SAS
It is a proprietary piece and less scalable for some applications. In addition, only specific purposes use SAS and power tools are not added to the vast library daily. However, it makes a point of being able to evaluate data from numerous sources and then instantly publish the findings into an excel spreadsheet.
- Excel
Businesses use it to maintain a consistent picture of the data; companies also utilize it to undertake real-time manipulation of data gathered from external sources, such as stock market feeds. Compared to other tools like R or Python, it helps carry out somewhat complicated data analytics. Financial analysts and sales managers frequently use it to address challenging business issues.
- Python
Python is extremely popular among developers since everything is an object. Compared to R, it is simpler to understand and can be built on any platform, including MongoDB and SQL servers. It may be used to extract data from the web and is highly helpful for big data research. Text data is also extremely nicely handled by it. Python installation can help a variety of platforms, including SQL Server, MongoDB, or JSON (JavaScript Object Notation). Instagram, Facebook, Spotify, and Amazon are a few businesses that use Python for data analytics.
- Tableau
Tableau is a fantastic business intelligence and data visualization application for reporting and analyzing vast amounts of data. It assists users in producing a variety of graphs, maps, dashboards, and stories to visualize and analyze data to aid in business decision-making. Tableau is one of the most well-liked business intelligence tools since it has so many interesting, distinctive features (BI).
3. Features of Power BI
The following are some of Power BI's features:
- Desktop Power BI
Power BI Desktop is a free program that you can download and install, enabling you to conveniently access data to create reports. You don't require sophisticated report designing or query skills to create a report while utilizing the Power BI desktop.
- Stream Analytics
The main benefit of Power BI for healthcare industry is its capabilities for stream analytics. With real-time Power BI healthcare data for analytics you can also use social media and industrial sensors to make quick decisions from analytical insights.
- Different Data Sources
One of Power BI's key features is support for diverse data sources. For example, to generate interactive visualizations, you can access various data sources, including Excel, CSV, SQL Server, Web files, etc.
- Custom Visualization
Power BI's default standard might not be adequate in some circumstances when working with complex data. In that situation, you can access the specific visualization library that suits your requirements.
- Pricing of Microsoft Power BI
The features you require and the type of package you select will determine the price of Microsoft Power BI. If you already have a Microsoft Enterprise Agreement (EA), you have Power BI in your EA subscription at no further cost.
Pro, Premium Per User, and Premium Per Capacity are the three main plans that Power BI offers.
4. Reasons to Use Power BI in Healthcare and Pharma
- A rapid start With a simple setup, no formal training needed, and built-in dashboards for services like Salesforce, Google Analytics, and Microsoft Dynamics, you can gain insights immediately.
- It has streamlined distribution and publication processes. Analysts upload reports and visualizations to the Power BI service rather than sending or storing big files on a shared disc to refresh their data whenever the underlying dataset is changed.
- Power BI healthcare dashboards are updated in real-time or streamed in, allowing users to solve issues and spot possibilities instantly. Real-time data visualizations can be displayed and edited in any report or dashboard. Factory sensors, social media sites, and other sources from which time-sensitive data can be gathered or communicated can all be streaming data sources.
- It can alter the navigation of the Power BI software. Report makers now can adjust navigation to make it easier for users to access content quickly and comprehend the connections between various reports and dashboards, thanks to an "app navigation experiences" feature.
- It has the adaptability of security features. To prevent users from viewing information they shouldn't, report developers can set up row-level security (RLS) access filters to ensure that viewers only see the data that applies to them.
- Integrating Microsoft's virtual assistant with Power BI is simpler and more compatible. Users can obtain charts and graphs by speaking questions in natural language. Those who utilize mobile devices may find this to be of particular benefit.
- Users of Power BI have access to text analytics and picture recognition, can build machine learning models, and can interface with Azure Machine Learning.
5. Conclusion
Clarion has been collaborating with clients to provide seamless BI solutions based on various technologies, including Power-BI and Cloud Analytics. Contact us at info@clariontech.com to hire our power bi consultants for healthcare if you need help deciding which BI tool is best for your business and are seeking a partner to help with implementation.
For more info you can check our blog use of Power BI as business intelligence solution.
Author


